
Final Grade Distribution
The final grade was calculated as follow:
|
Exclusions |
40% |
|
Subjective Behavior |
25% |
|
Racial Disparity |
35% |
Exclusion is the combined rate of out of school suspensions, expulsions, emergency removal by a hearing officer and removal by District/School personnel. There is also a penalty for any exclusions in pre-kindergarten through 3rd grade and excessive exclusions in the 9th grade. Subjective Behavior Grade Schools received a grade if they had a large portion of exclusions for inappropriate discipline and non-violent behavior that is subject to individual comfort level and biases. The subjective behavior grade was based on the percentage of exclusions that was for disruptive/disobedient behavior, harassment/intimidation, and unwelcome sexual conduct. Racial disparity is the difference in exclusion based on race. In this report, it is measured by dividing the rate of the racial group with the highest exclusions by the rate of the racial group with the lowest exclusions
Final Letter Grade
There were 1173 districts/schools in this analysis. Of 1173, 212 (18.1%) received no grade because they appeared to be districts not required to report or they reported data through another encompassing District/School. A total of 961 districts received a grade.
Three (.3%) received an A+ for scoring a 100 on exclusion, subjective behavior, and racial disparity. Those districts were: Ottoville Local, Pettisville and Russia Local. All three of these districts were public districts, and all were Type 2 Rural districts.
887 (75.6%) received an "F." Of those districts, 83 (7.1%) were schools/districts that were required to report information and did not.
|
2019 Ohio School Discipline Final Letter Grade |
|||
|
Frequency |
Percent |
Valid Percent |
|
|
A+ (99.5 through 100) |
3 |
0.3 |
0.3 |
|
A (93.5 through 99.4) |
7 |
0.6 |
0.7 |
|
A- (89.5 through 93.4) |
2 |
0.2 |
0.2 |
|
B+ (86.5 through 89.4) |
3 |
0.3 |
0.3 |
|
B (83.5 through 86.4) |
5 |
0.4 |
0.5 |
|
B- (79.5 through 83.4) |
2 |
0.2 |
0.2 |
|
C+ (76.5 through 79.4) |
6 |
0.5 |
0.6 |
|
C (73.5 through 76.4) |
2 |
0.2 |
0.2 |
|
C- (69.5 through 73.4) |
4 |
0.3 |
0.4 |
|
D+ (66.5 through 69.4) |
7 |
0.6 |
0.7 |
|
D (63.5 through 66.4) |
11 |
0.9 |
1.1 |
|
D- (59.5 through 63.4) |
22 |
1.9 |
2.3 |
|
F (.01 through 59.4) |
804 |
68.5 |
83.7 |
|
F (No Data Reported) |
83 |
7.1 |
8.6 |
|
Total |
961 |
81.9 |
100.0 |
|
Missing Information |
212 |
18.1 |
|
|
1173 |
100.0 |
||
|
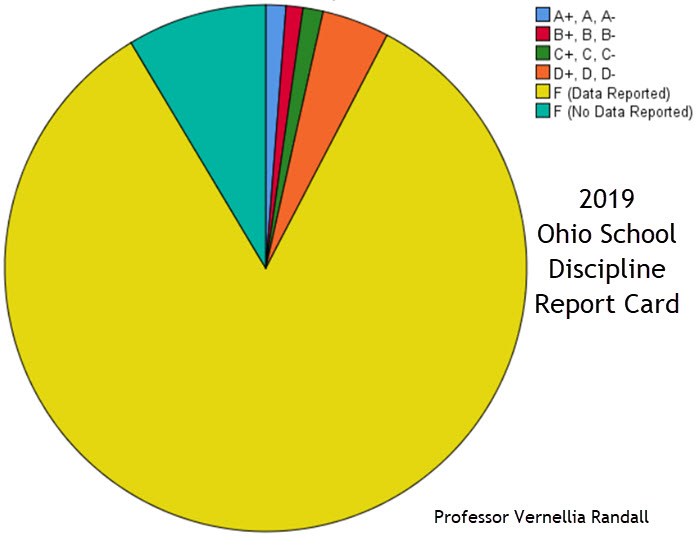
2019 Ohio School Discipline Final Letter Grade - Grouped |
|||
|
|
Frequency |
Percent |
Valid Percent |
|
A+, A, A- |
12 |
1.0 |
1.2 |
|
B+, B, B- |
10 |
0.9 |
1.0 |
|
C+, C, C- |
12 |
1.0 |
1.2 |
|
D+, D, D- |
40 |
3.4 |
4.2 |
|
F (Data Reported) |
804 |
68.5 |
83.7 |
|
F (No Data Reported) |
83 |
7.1 |
8.6 |
|
Total |
961 |
81.9 |
100.0 |
|
Missing |
212 |
18.1 |
|
|
1173 |
100.0 |
||
Final Numerical Grade
A total of 878 districts/schools(74.9%) received a numerical grade. Schools did not receive a numerical grade if they did not report either exclusion data or enrollment data. Some schools reported both exclusion data and enrollment data as "<10". For those schools, they were assigned "3" for exclusions and "5" as enrollment.
The average Final numerical grade was 38.3; Half the schools/districts had a grade below 37.3. The lowest Final Grade was -14.4, and the highest was 100.
Public Districts had a higher mean final grade (42.0) than Community (Charter) Schools (30.1). This difference was statistically significant (p=.000). That is, there is zero probability that this difference occurred by chance.
Urban schools had the lowest mean Final Numerical Grade(16.6), and Suburban schools had the highest mean Final Numerical Grade (54.2). This difference was statistically significant (p=.000). That is, there is zero probability that this difference occurred by chance.
|
2019 Ohio School Discipline |
||||
|
Number of Districts |
Mean |
Median |
Minimum |
Maximum |
|
878 |
38.3 |
37.3 |
-14.4 |
100.0 |
|
2019 Ohio School Discipline Final Numerical Grade |
||||||
|
|
Number of |
% of |
Mean |
Median |
Minimum |
Maximum |
|
Community (Charter) School |
272 |
31.0% |
30.1 |
26.8 |
-14.4 |
96.3 |
|
Public District/School |
606 |
69.0% |
42.0 |
40.8 |
7.7 |
100.0 |
|
ANOVA |
||||||
|
Sum of Squares |
df |
Mean Square |
F |
Sig. |
||
|
26456.512 |
1 |
26456.5 |
111.6 |
0.000 |
||
|
2019 Ohio School Discipline Final Numerical Grade |
||||||
|
N |
% of Total N |
Mean |
Median |
Minimum |
Maximum |
|
|
Type 1: Rural - High Student Poverty & Small Student Population |
123 |
20.33% |
42.3 |
40.0 |
13.1 |
92.2 |
|
Type 2: Rural - Average Student Poverty & Very Small Student Population |
105 |
17.36% |
48.3 |
44.5 |
21.4 |
100.0 |
|
Type 3: Small Town - Low Student Poverty & Small Student Population |
110 |
18.18% |
45.8 |
43.9 |
27.0 |
94.4 |
|
Type 4: Small Town - High Student Poverty & Average Student Population Size |
89 |
14.71% |
38.1 |
38.2 |
16.2 |
78.3 |
|
Type 5: Suburban - Low Student Poverty & Average Student Population Size |
77 |
12.73% |
38.9 |
38.8 |
15.0 |
64.2 |
|
Type 6: Suburban - Very Low Student Poverty & Large Student Population |
46 |
7.60% |
54.2 |
52.5 |
26.7 |
88.7 |
|
Type 7: Urban - High Student Poverty & Average Student Population |
47 |
7.77% |
22.5 |
22.2 |
10.3 |
44.3 |
|
Type 8: Urban - Very High Student Poverty & Very Large Student Population |
8 |
1.32% |
16.6 |
16.9 |
7.7 |
23.0 |
|
Sum of Squares |
df |
Mean Square |
F |
Sig. |
||
|
37691.864 |
7 |
5384.552 |
30.481 |
0.000 |
||
Exclusion Grade
Exclusion is the combined rate of out of school suspensions, expulsions, emergency removal by a hearing officer and removal by District/School personnel. There is also a penalty for any exclusions in pre-kindergarten through 3rd grade and excessive exclusions in the 9th grade. To see the specifics of how this grade was constructed, click on this link.
The average Final Exclusion grade was 37.0; Half the schools/districts had a grade below 38. The lowest Final Exclusion Grade was -44.7, and the highest was 100.
Public Districts had a higher mean grade (46.7) than Community (Charter) Schools (15.4). This difference was statistically significant (p=.000).
Urban schools had the lowest mean (-11.1) Exclusion - Final Grade; and Suburban schools had the highest mean Exclusion - Final Grade (68.7). This difference was statistically significant (p=.000).
|
2019 Ohio School Exclusion Grade |
||||
|
Number of Districts |
Mean |
Median |
Minimum |
Maximum |
|
878 |
37.0 |
38.0 |
-44.7 |
100.0 |
Subjective Behavior Grade
Schools received a grade if they had a large portion of exclusions for inappropriate discipline and non-violent behavior that is subject to individual comfort level and biases. The subjective behavior grade was based on the percentage of exclusions that was for disruptive/disobedient behavior, harassment/intimidation, and unwelcome sexual conduct. To see the specifics of how this grade was constructed, click on this link.
Of the 880 districts that reported Initial Subject Behavior Discipline grade, the median grade was 39.8. The average was 41.0; the lowest was 0, and the highest was 100.
The mean for Community (charter) schools (40.0) was lower than the mean for Public Districts (41.0). This difference was not statistically significant (p=.275); That is there is a 27.5% chance that the difference occurred by chance alone.
Type 8 Urban districts had a lower mean grade (28.0) and Type 6 suburban districts (49.1) had the highest mean grade(49.1). This difference was statistically significant (p=.000).
|
2019 Ohio School Subjective Behavior Grade |
||||
|
Number of Districts |
Mean |
Median |
Minimum |
Maximum |
|
878 |
41.0 |
39.8 |
-10.0 |
100.0 |
Racial Disparity Grade
Racial disparity is the difference in exclusion based on race. In this report, it is measured by dividing the rate of the racial group with the highest exclusions by the rate of the racial group with the lowest exclusions. To see the specifics of how this grade was constructed, click on this link.
The average Racial Disparity grade was 37.9; Half the schools/districts had a grade below 40. The lowest Racial Disparity Grade was 0, and the highest was 100.
Community (Charter) Schools had a higher mean grade (40.1) than Public District/School (37). That difference was statistically significant (p=.005). That is, there was less than a .5% probability that the difference occurred by chance alone.
Type 3 Small Town districts earned the lowest mean grade (34.6) while Type 6 Suburban districts earned the highest mean grade (41.4). However, the difference in racial disparity grade was not statistically significant. (p=.215).
|
2019 Ohio School Racial Disparity Grade |
|||||
|
Number of |
% of |
Mean |
Median |
Minimum |
Maximum |
|
878 |
100.0% |
37.9 |
40.0 |
0 |
100 |
Best Schools/Districts Overall
Of the nine schools/districts on this list, 5 ( 55.6% ) are public districts, Type 2 rural schools.
|
IRN |
District/School Name |
Numerical Grade |
Organization Type |
Typology of Public Districts |
|
049387 |
Ottoville Local |
100.0 |
Public District/School |
Type 2: Rural - Average Student Poverty & Very Small Student Population |
|
047076 |
Pettisville Local |
100.0 |
Public District/School |
Type 2: Rural - Average Student Poverty & Very Small Student Population |
|
049817 |
Russia Local |
100.0 |
Public District/School |
Type 2: Rural - Average Student Poverty & Very Small Student Population |
|
000556 |
A+ Arts Academy |
96.3 |
Community (Charter) School |
|
|
011468 |
Columbus Bilingual Academy-North |
96.3 |
Community (Charter) School |
|
|
048553 |
Marion Local |
96.2 |
Public District/School |
Type 2: Rural - Average Student Poverty & Very Small Student Population |
|
000525 |
Canton Harbor High School |
94.5 |
Community (Charter) School |
|
|
012038 |
Old Brook High School |
94.5 |
Community (Charter) School |
|
|
048587 |
St Henry Consolidated Local |
94.5 |
Public District/School |
Type 2: Rural - Average Student Poverty & Very Small Student Population |
Worst Schools/Districts Overall
Of the twelve schools/districts on this list, 9 ( 75.0% ) are community (charter) schools. All the public districts were Type 7 or Type 8 Urban schools.
|
IRN |
District/School Name |
Numerical Grade |
Organization Type |
Typology of Public Districts |
|
148932 |
Franklin Local Community School |
-14.4 |
Community (Charter) School |
|
|
016858 |
United Preparatory Academy East |
3.9 |
Community (Charter) School |
|
|
011507 |
Achieve Career Preparatory Academy |
4.3 |
Community (Charter) School |
|
|
014063 |
University Academy |
6.2 |
Community (Charter) School |
|
|
044909 |
Toledo City |
7.7 |
Public District/School |
Type 8: Urban - Very High Student Poverty & Very Large Student Population |
|
014064 |
Winton Preparatory Academy |
8.1 |
Community (Charter) School |
|
|
132944 |
Miami Valley Academies |
9.1 |
Community (Charter) School |
|
|
044297 |
Mansfield City |
10.3 |
Public District/School |
Type 7: Urban - High Student Poverty & Average Student Population |
|
013253 |
Ohio College Preparatory School |
11.0 |
Community (Charter) School |
|
|
015712 |
Euclid Preparatory School |
11.2 |
Community (Charter) School |
|
|
015709 |
Beacon Academy |
11.3 |
Community (Charter) School |
|
|
044990 |
Warren City |
11.4 |
Public District/School |
Type 7: Urban - High Student Poverty & Average Student Population |
Searchable Database - Overall Grade
This database covers only information related to Overall Grade.
For more detail see individual schools/District/School page.
This database list of all records (initially) or records that meet the condition (on search), and a detailed view of the selected record. The database only includes information about the overall grade. For more information about an individual district/school click here.
For More Information on Racial Justice Now and School Discipline:
RJNOhio.org